Canvas
Analyze your cloud architecture and its relationships in one place.
Overview
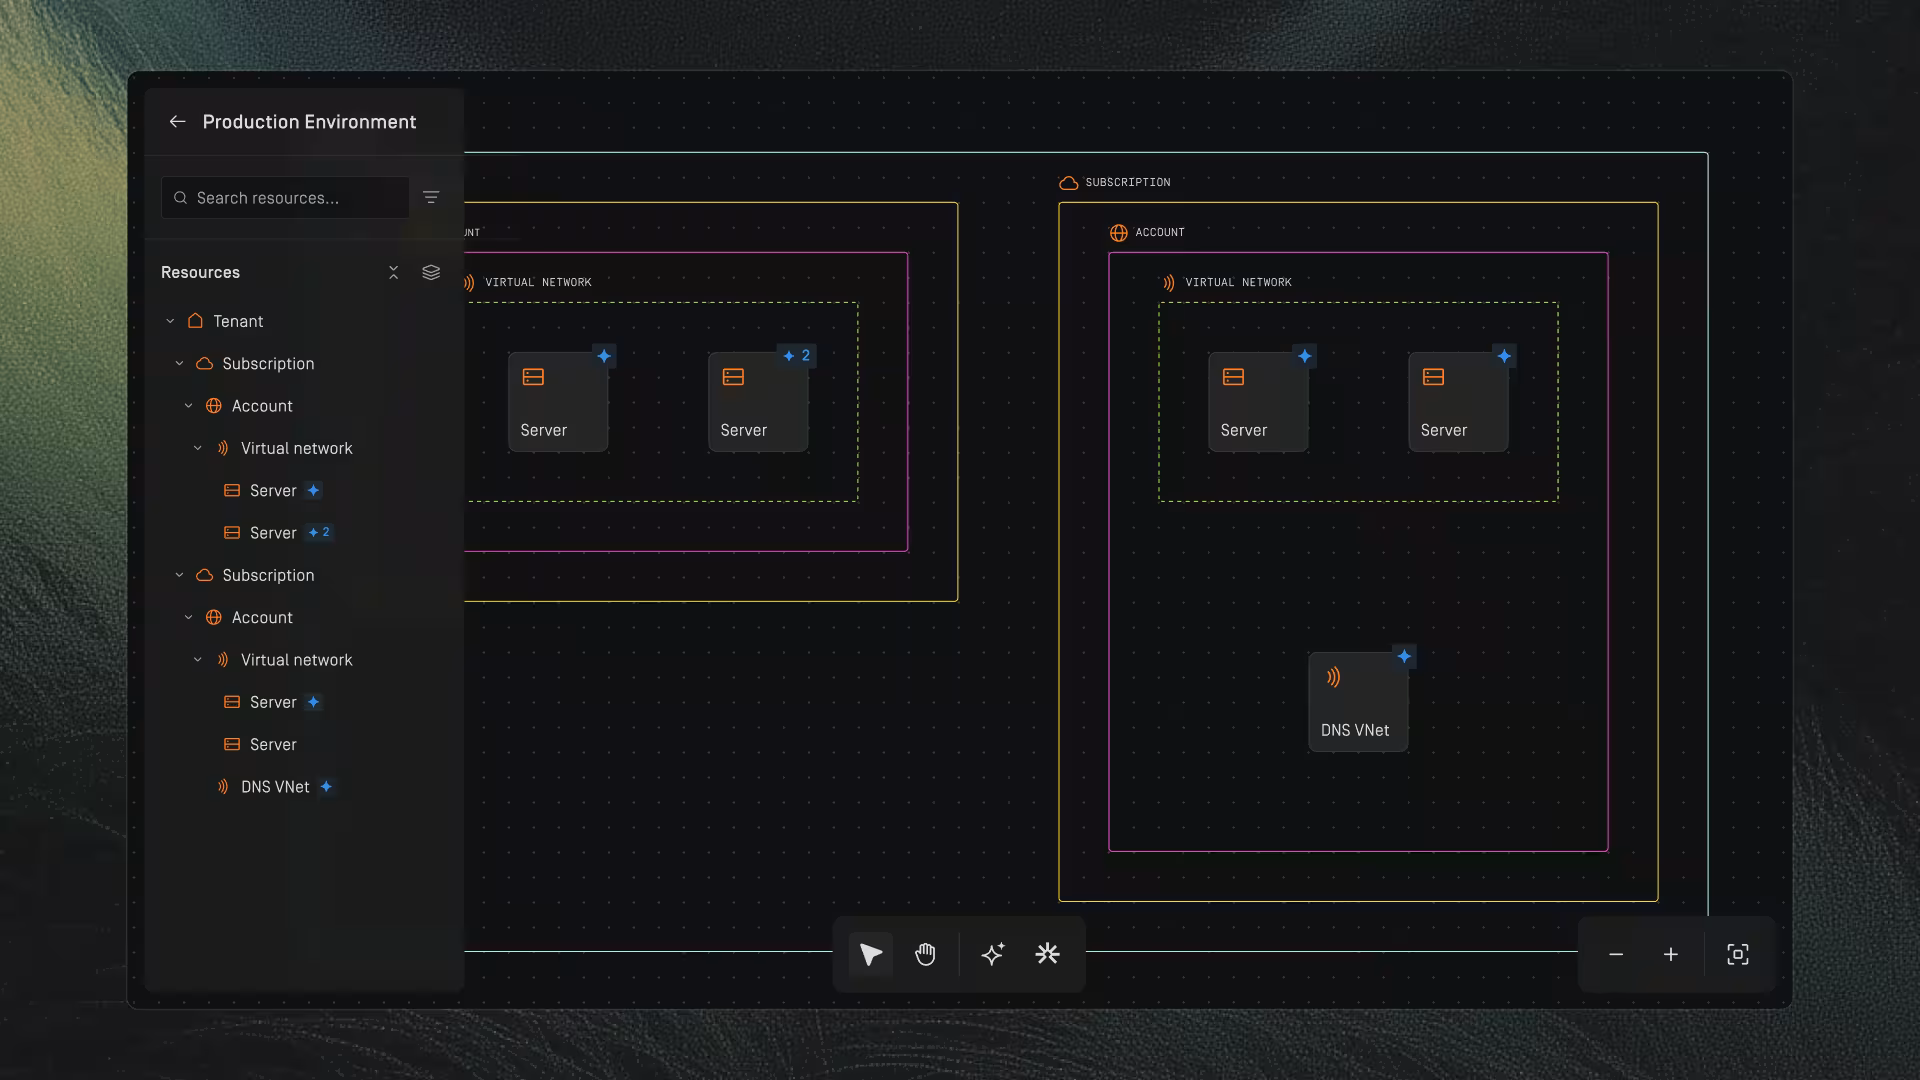
The Canvas is where you explore, navigate, and analyze your cloud architecture. It visualizes all resources discovered in your environment and provides tools to search, filter, inspect, group, hide, collapse, and understand relationships across your infrastructure.
The canvas experience is made up of multiple functional areas:
- The Resource panel on the left
- The Rightside panel (Details, Insights, Relations)
- Canvas navigation tools
- Toolbar tools (Pointer, Hand, Insights, Zoom, Chat coming soon)
Each part works together to help you interact with complex environments easily and clearly.
Resources

Resource list
The Resource panel (left side) lists every discovered resource in your cloud environment, organized by provider, region, and grouping.
How to open/close the resource panel
- Click the sidebar icon at the top left to collapse or expand the panel.
What you see
- Hierarchical resource list (by provider → region → service → resource)
- Icons for each resource type
- Insight counts and bundle counts
- Hide/unhide controls
- Bundling controls
- Hide and show children and parent resources
Search and filter
Search lets you quickly find any resource in your architecture.
How to use
- Click the Search resources… bar at the top of the left panel.
- Type a resource name or identifier.
- Click the result to jump to that resource on the canvas.
This moves the canvas to the resource and highlights it.
Bundling
Bundling groups resources of the same kind into a compact visual stack to reduce noise.
How it works
- Bundles are created and controlled using the orange stack icon in the resource panel (top right of the list).
- Clicking the icon will bundle or unbundle resources where supported.
Important details
- Bundling groups similar resources only (same type).
- Bundling changes the visual representation, not the underlying resources.
- Bundled items still show detail counts on the canvas.
Hide and reveal
Dawnguard lets you reduce visual noise on the canvas by hiding individual resources or collapsing entire groups. This helps you focus on specific areas of the architecture without permanently removing anything.
From the left panel
- Click the eye icon next to a resource → hides that resource
- Click the eye icon next to a group → collapses the entire group
From the right panel
- Select a resource on the canvas
- Click the Hide resource icon in the right panel
How to show or expand again
- Hidden items show an eye‑closed icon
- Click the same icon to reveal a resource or expand a collapsed group
Resources on Canvas
A resource is an identifiable object within a cloud environment:
Compute, database, networking, storage, security, or any cloud‑based component.
Each resource appears on the canvas with:
- Its icon
- Its name
- Blue star = insight count
- Orange stack = bundle count
Selecting a resource opens the right‑side panel for deeper analysis.
Resource Details
Resource properties
When you click a resource, the Details tab opens in the right panel.
Details include:
- Resource name
- Provider
- Type
- Configuration
- Metadata
Bundled resource behavior
If you click a bundled object:
- You first see the bundle
- You must click a specific resource within the bundle list to view its individual details
Resource Insights
Resource insights appear as:
- A blue star icon on the resource on the canvas
- A matching blue star count in the left resource panel
Higher numbers = more insights for that resource.
How to open resource insights
You can open resource‑specific insights in two ways:
From the canvas
- Click the resource or its blue star badge
- The right panel opens
- Click Insights to view all insights for that resource
From the left resource panel
- Locate the resource
- Click the resource (blue star count is shown next to it)
- In the right panel, click Insights
This is especially useful when:
- The resource is bundled
- The canvas is zoomed out
- A resource is visually behind others
What the Insights tab shows
- Severity
- Description
- What triggered the insight
- Guardrails involved
- Recommended actions
Resource Relationships
Resource relations show incoming and outgoing connections, including cross‑subscription connections.
How to use
- Click a resource (from canvas or left panel).
- Click the Relations tab on the right panel.
- View:
- Incoming traffic
- Outgoing traffic
- Connected resources
- Links across VPCs/VNETs/subscriptions
Fit to screen (relations)
Click Fit relations to screen to zoom the canvas and show only the selected resource and its connections, sized to your screen.
Resource groupings
The canvas automatically organizes your cloud environment into grouped visual containers, helping you understand structure, boundaries, and relationships at a glance. These groupings are generated directly from your cloud provider’s hierarchy and represent real architectural separation.
Groupings appear as colored bounding boxes outlining major units within the environment. You’ll typically see:
Subscription / Account
- The outermost boundary
- Represents the entire cloud account or subscription
- Contains all regions, services, and resources within that account
Region-level
- Nested boxes representing cloud regions (e.g., eu-west, us-east‑1, ap-southeast‑2)
- All resources inside this group physically live in that cloud region
Service / logical
Inside each region, resources are further grouped by service or function type, for example:
- Networking
- Compute
- Storage
- Security
- Databases
- Messaging
- DevOps components
Nested service structures
Some services, such as Kubernetes clusters, VNet substructures, firewall rulesets, or resource group containers, appear as deeper nested boxes to reflect:
- Sub‑components
- Child resources
- Environments (e.g., staging vs. production)
- Logical segmentation
Why Groupings Matter
Groupings provide immediate clarity on:
- How your architecture is structured
- Where resources live
- Which resources belong to each region or service
- Boundaries between environments
- Dependencies within and across regions
- How traffic flows between components
Insights Panel
The Insights tool opens the insights panel for the architecture currently displayed on the canvas.
This panel helps you understand risks, misconfigurations, and improvement opportunities across your cloud environment.
How to get to Insights
- Open any architecture on the canvas.
- Click the Insights icon (the star icon ⭐) in the toolbar.
This opens the Insights panel on the right side of the screen.
How to use Insights
Once the panel is open, you can:
- View all detected insights for the architecture
- Search insights using the search bar
- Filter or sort insights by type, severity, or guardrail
- Drill into impact, severity, affected resources, and recommended remediation steps
- Identify which guardrails triggered each insight
Insights help you improve security posture, performance, reliability, and compliance alignment.
Tools
Pointer Tool
The Pointer tool is the default selection tool used to interact with objects on the canvas. It allows you to select objects, open context menus, and navigate.
You can select the Pointer tool by clicking the Pointer Tool button in the toolbar or by pressing V on your keyboard.
Hand Tool
The Hand tool is used to pan and reposition the canvas by clicking and dragging. It allows you to quickly move around the workspace to view different areas of your design.
You can select the Hand tool by clicking the Hand Tool button in the toolbar or by pressing H on your keyboard. The Hand tool can also be temporarily activated in any mode by holding the Spacebar and dragging the canvas.
Insights
The Insights tool opens the insights panel for the architecture currently displayed on the canvas.
This panel helps you understand risks, misconfigurations, and improvement opportunities across your cloud environment.
How to get to Insights
- Open any architecture on the canvas.
- Click the Insights icon (the star icon ⭐) in the toolbar.
This opens the Insights panel on the right side of the screen.
How to use Insights
Once the panel is open, you can:
- View all detected insights for the architecture
- Search insights using the search bar
- Filter or sort insights by type, severity, or guardrail
- Drill into impact, severity, affected resources, and recommended remediation steps
- Identify which guardrails triggered each insight
Insights help you improve security posture, performance, reliability, and compliance alignment.
Zoom Controls
You can zoom in by clicking the + button on the zoom bar, or by pressing ⌘ + (on Mac) or Ctrl + (on Windows).
You can zoom out by clicking the – button on the zoom bar, or by pressing ⌘ – (on Mac) or Ctrl – (on Windows).
To fit the architecture to the canvas, click the Fit to Screen button or press F on your keyboard.
Chat(Coming Soon)
The Chat panel will allow you to interact with Dawnguard AI.
How to access (once available)
- Click the Chat icon in the toolbar
You will be able to
- Ask questions
- Request explanation for design choices
- Explore alternatives
- Regenerate or refine architecture