Analytics
Gain visibility into your organization's security insights, maturity score, and trends over time.
Overview
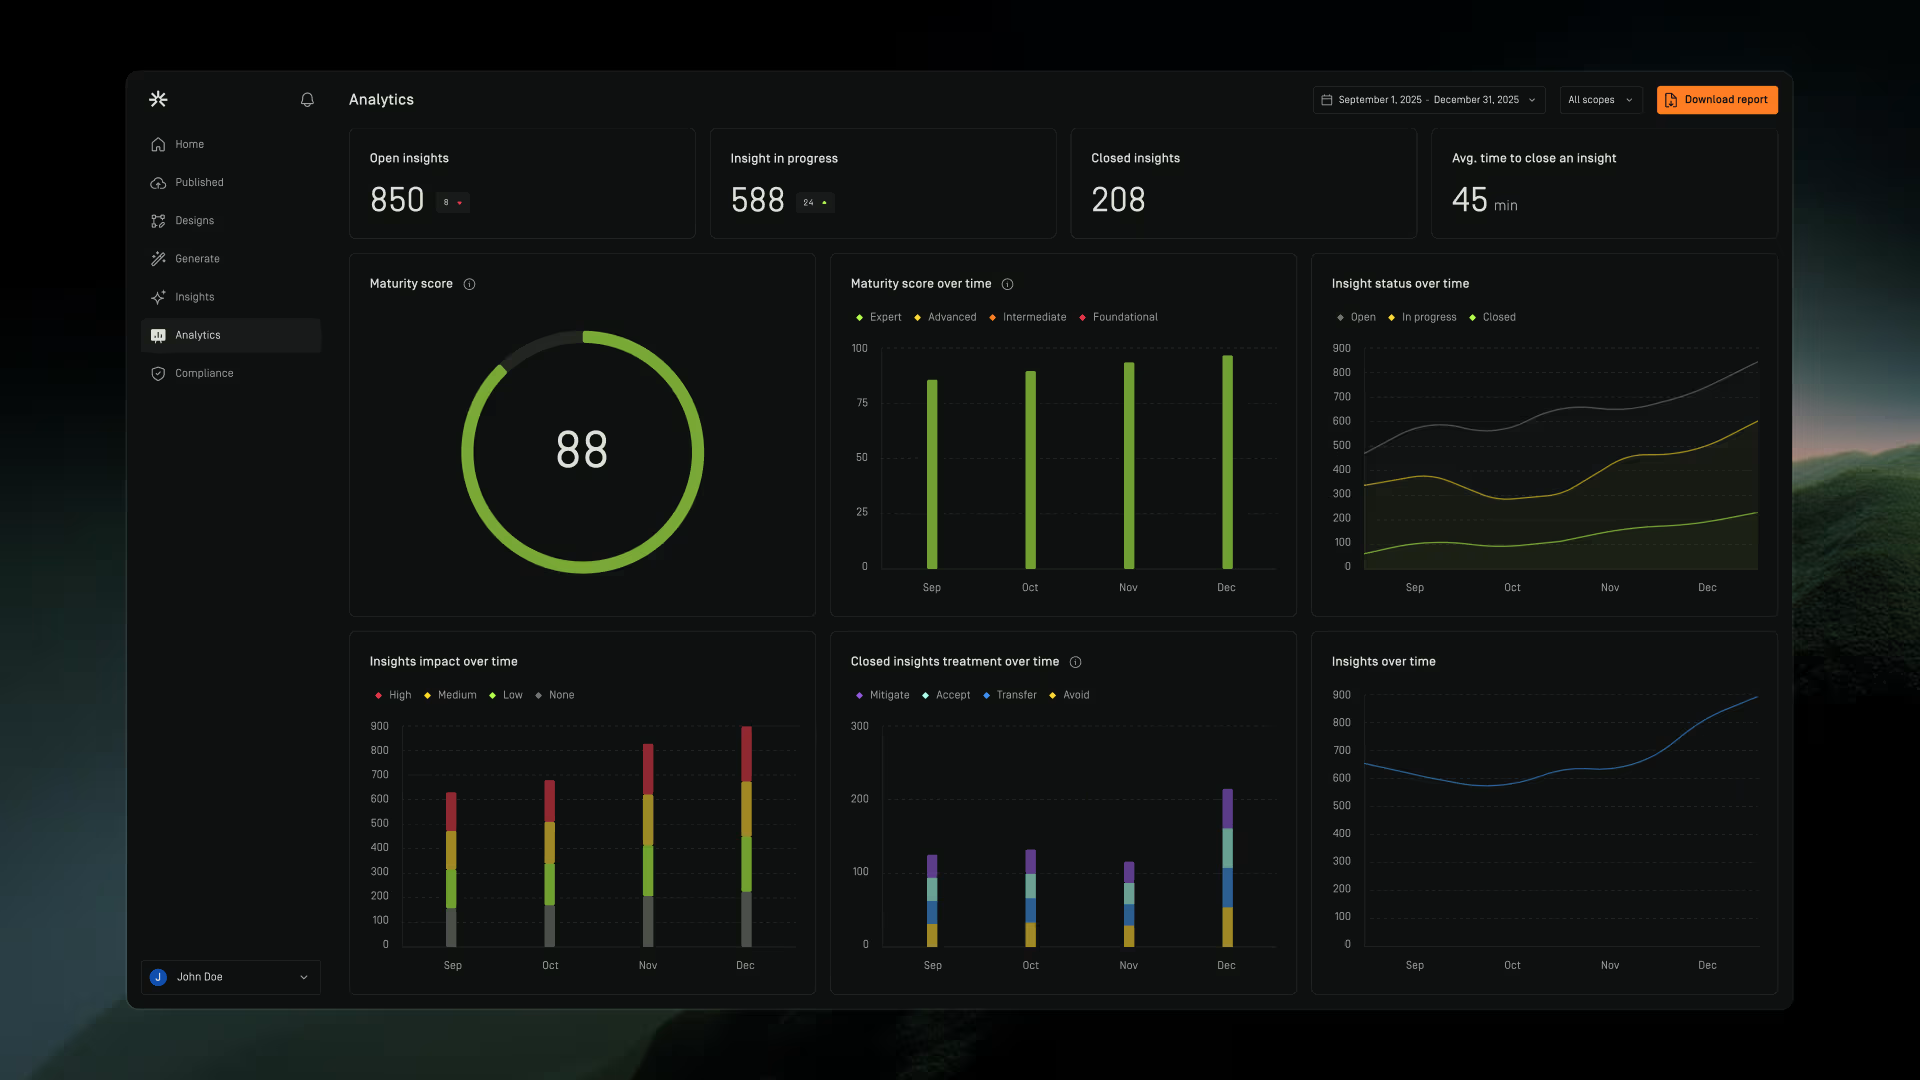
The Analytics page provides a high-level view of how you’re improving your organization’s security with Dawnguard.
The page is designed to answer two key questions:
- Where do we stand today?
- Are we improving over time?
The Insight Snapshot and Maturity Score sections provide a point-in-time view of your current state, while the trend charts help you understand how your organization is progressing over time.
All charts and metrics can be filtered using the available date and scope filters.
Analytics Filters
Date Filter
Use the date filter to specify the reporting period displayed throughout Analytics.
All metrics, charts, and trends are updated based on the selected date range.
Scope Filter
Use the scope filter to compare analytics across all scopes.
When a specific scope is selected, the Analytics page automatically displays metrics and trends for that scope.

Insight Overview
The Insight Overview section provides a summary of the current state of your insights.
This section is designed to show where you stand today and provide a quick overview of current insight activity.
Open Insights
Displays the total number of insights that are currently open.
Insights In Progress
Displays the total number of insights that are actively being worked on.
Closed Insights
Displays the total number of insights that have been closed.
Average Time to Close an Insight
Displays the average time taken to close an insight within the selected reporting period.
Maturity
Maturity Score
The Maturity Score provides a high-level measure of your organization's security maturity.
The score ranges from 0 to 100 and is calculated as the average impact score of all insights associated with your organization.
Maturity Levels
Foundational
Security practices exist but are not yet consistently applied across the environment.
Defined
Security measures are being applied across the environment, but important areas still require improvement.
Measured
Security and architectural practices are consistently applied and monitored across the environment.
Optimized
Security practices are well established and aligned with organizational needs, with a focus on continuous improvement.
Maturity Score Over Time
The Maturity Trend chart shows how your Maturity Score changes over time.
Use this chart to monitor improvements and track progress toward higher maturity levels.
How to Interpret This Chart
A healthy trend is one that moves upward over time.
For example:
- Defined → Measured
- Measured → Optimized
A declining maturity score may indicate that risks are increasing faster than they are being addressed.
Insight Trends
Insights Over Time
Track how the total number of insights changes over the selected reporting period.
This chart helps you understand whether the overall volume of findings in your environment is increasing, decreasing, or remaining stable over time.
How to Interpret This Chart
Ideally, the overall number of insights should decrease over time as findings are addressed and resolved.
Insight Status Over Time
Track how insights progress through their lifecycle over time.
This chart shows insights grouped by the following statuses:
- Open
- In Progress
- Closed
Use this chart to monitor remediation progress and understand how insights move from identification to resolution.
How to Interpret This Chart
A healthy trend typically shows:
- Open insights decreasing over time
- Closed insights increasing over time
- In-progress insights remaining relatively stable
A growing number of in-progress insights without a corresponding increase in closed insights may indicate that work is being started but not completed.
Insights Impact Over Time
Understand how the severity of insights changes over time.
This chart groups insights by impact level, helping you identify whether higher-risk findings are being reduced over time.
How to Interpret This Chart
Over time, you should expect to see:
- Fewer high-impact insights
- Fewer medium-impact insights
- More low-impact insights
For example, reducing a large number of high-impact insights to lower-impact findings may indicate that overall risk has been reduced, even if the total number of insights remains similar.
Closed Insights Treatment Over Time
Understand how risks are being addressed across your environment over time.
This chart groups closed insights by the following treatment categories:
- Mitigate
- Accept
- Transfer
- Avoid
Use this chart to understand how your organization responds to identified risks.
How to Interpret This Chart
Mitigate is generally the preferred outcome, as it indicates that the underlying issue has been addressed. Over time, you would typically expect Mitigate to represent the largest portion of closed insights.
An increasing number of Accept treatments may indicate that the organization is taking on more risk rather than addressing it.
Transfer treatments are generally acceptable when risk is appropriately transferred to another party or control mechanism.
A significant increase in Avoid treatments may indicate that business opportunities or initiatives are being avoided because of security concerns.
When reviewing this chart, focus not only on the number of closed insights, but also on how those insights were resolved.
Analytics Report
Use Download Report to generate a tailored Analytics report for the selected date range and scope.
The report helps you understand how your environment is evolving over time by summarizing key insight metrics, maturity information, WAF pillar scores, and analytics charts. It also includes short narrative summaries that highlight important trends, areas that may need attention, and opportunities for improvement.
To download an Analytics report:
- Go to Analytics.
- Select the date range and scope you want to report on.
- Click Download Report.
The report is generated using the currently selected filters and downloaded to your device.